
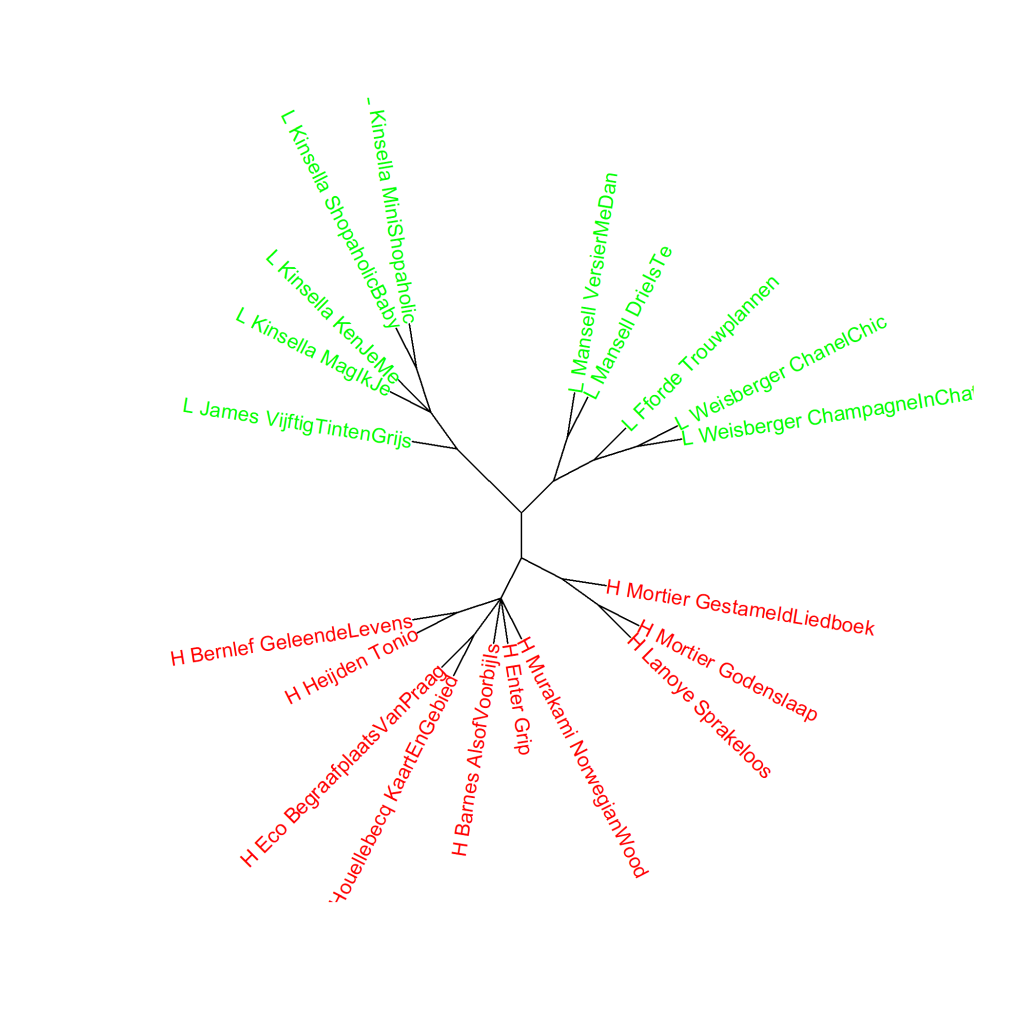
Colour version of the graph on p. 65 of The Riddle of Literary Quality.
The 10 novels with the highest (H) and lowest (L) scores for literary quality, cluster analysis (100 most frequent words).
Measure: Classic Delta (the Delta score is indicated below the horizontal axis).
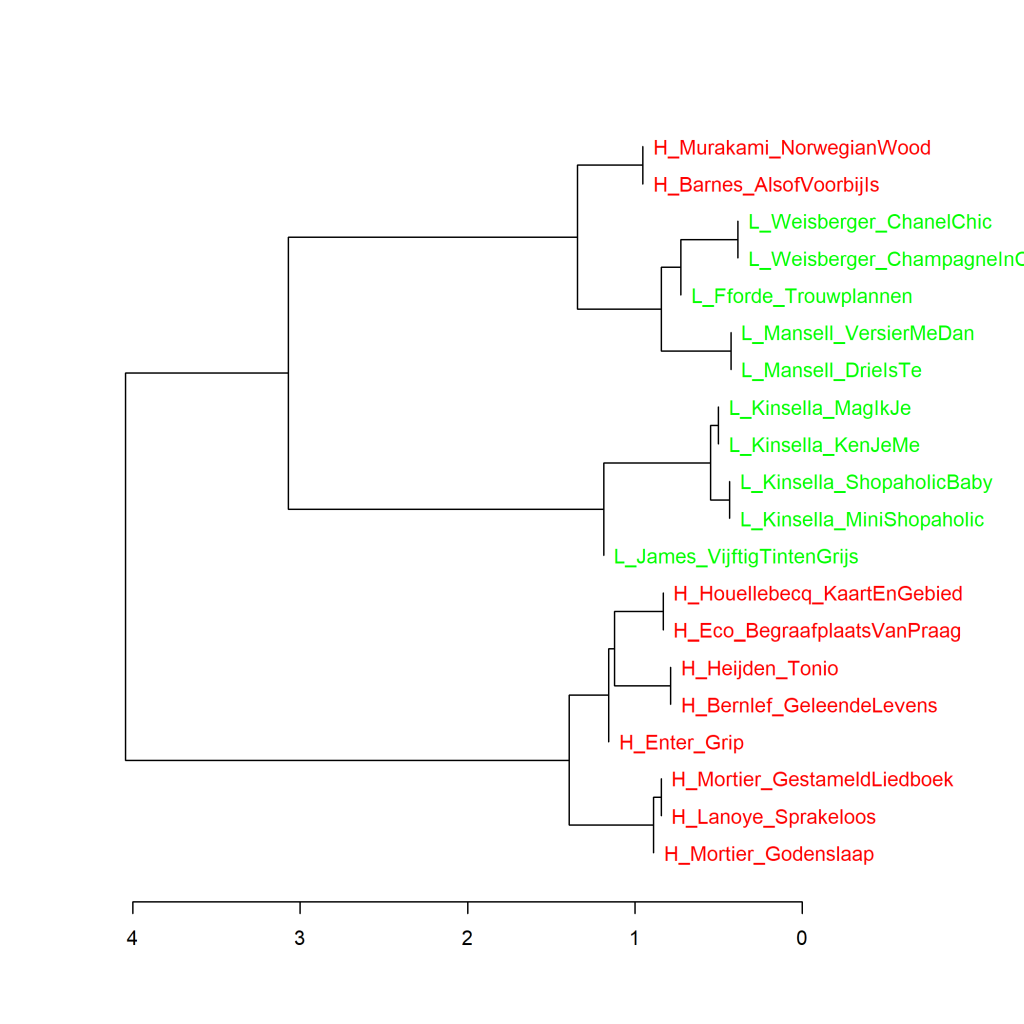
Figure 3.1 shows that two books from the top 10, namely Alsof het voorij is (The Sense of an Ending) by Julian Barnes and Norwegian wood (Norwegian Wood) by Haruki Murakami are more similar in the use of the 100 most frequent words to the cluster of books by Weisberger, Fforde and Mansell that received very low scores for literary quality and to the cluster Kinsella and James, than to the 8 other novels that received the highest literary scores.
###Additional graphs: Top 10 most literary and least literary Like Figure 3.1 in the book, the additional graphs below were created using the Stylo Package for R, developed by Maciej Eder, Mike Kestemont, Jan Rybicki, and Steffen Pielström. See the Computational Stylistics Group for more information about Stylo.
Below Figure 3.1.1 one may find more information about principal components analysis (PCA). Below Figure 3.1.2, cluster analysis and the Delta score are explained in more detail and Figure 3.1.2 has more on the bootstrap consensus tree.
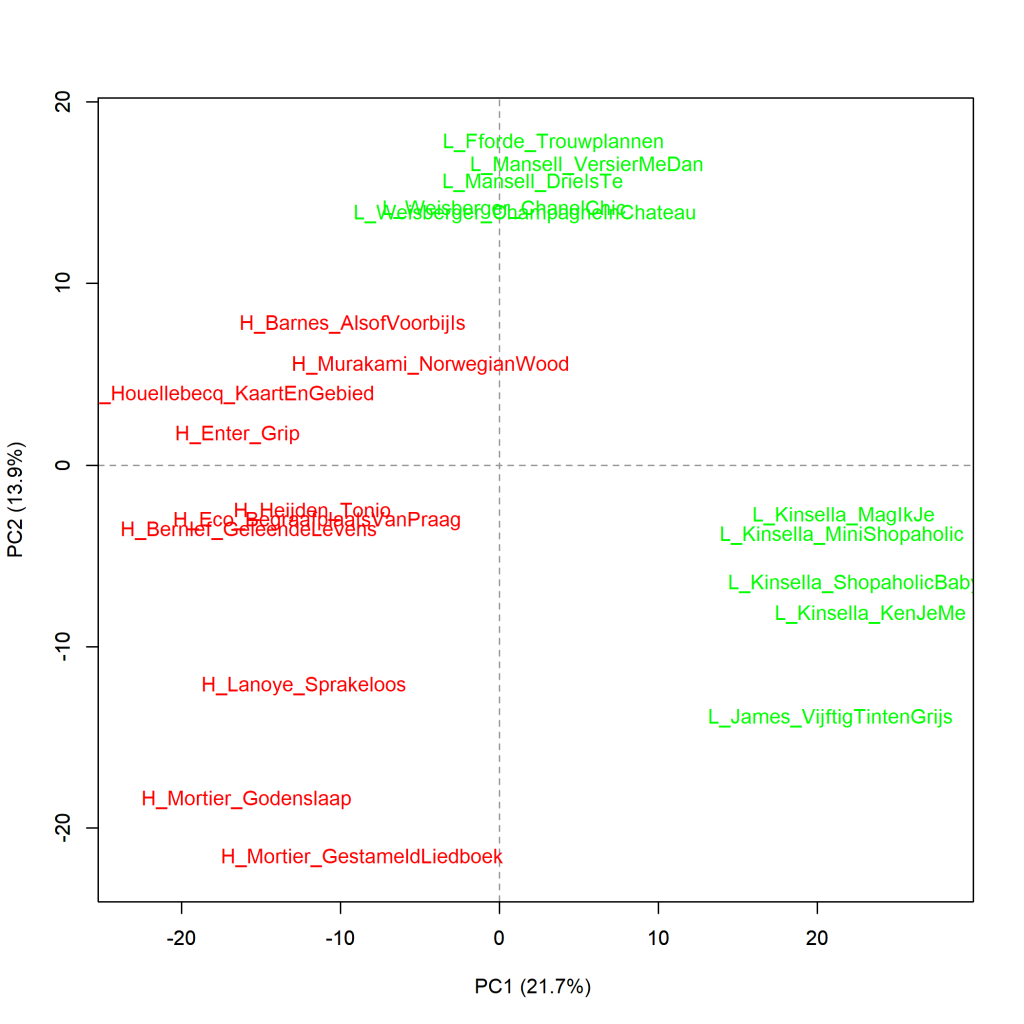
Figure 3.1.1: Top 10 most literary and least literary
Principal components analysis (100 most frequent words). Measure: PCA, correlation version.
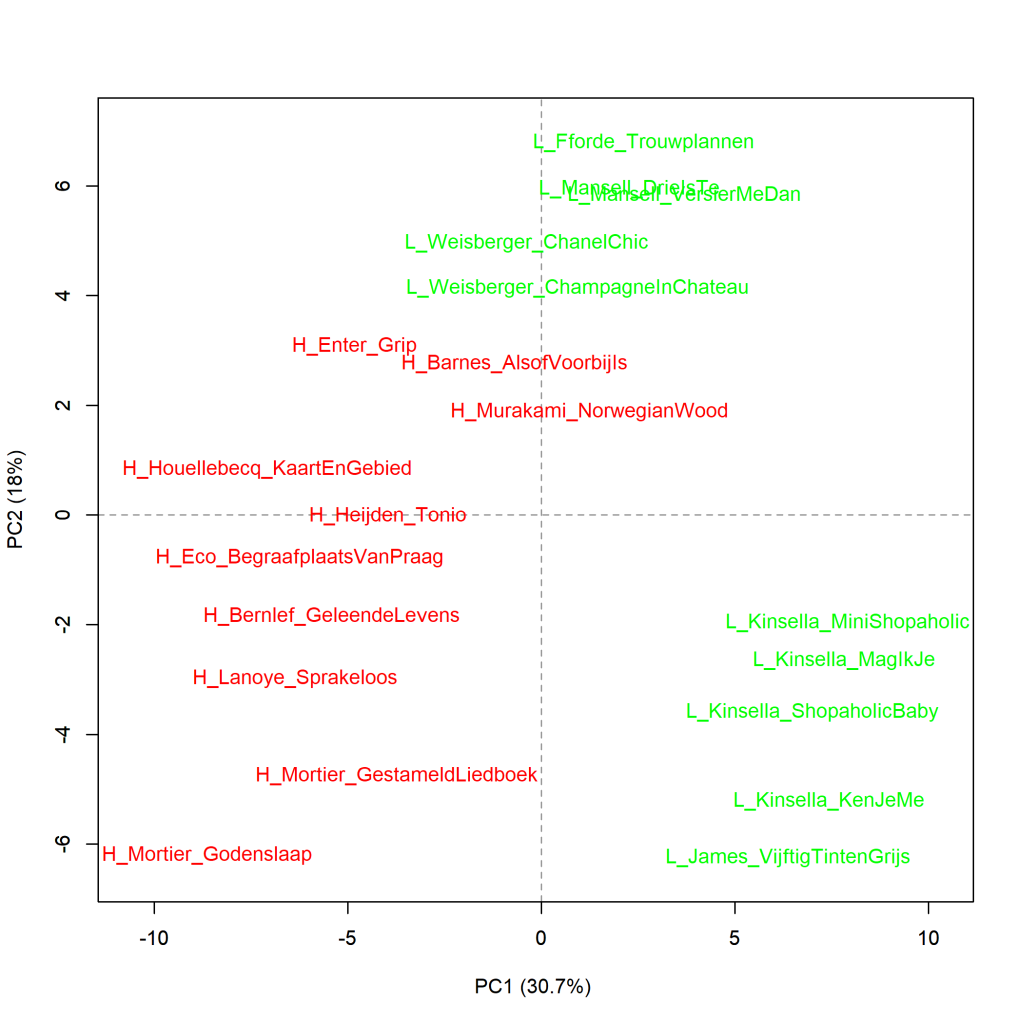 The graph above shows a visualisation of a principal components analysis (PCA) for the 100 most frequent words. The proportions are in line with what the cluster analysis (Figure 3.1) already showed. In the graph below, the words that are strikingly more frequent in the different novels have been added to the graph (loadings). An example: In Grip by Stephan Enter, the word zich is used remarkably more often than in the other novels; in Fifty Shades of Grey by E.L. James, the greater proportion of mijn stands out.
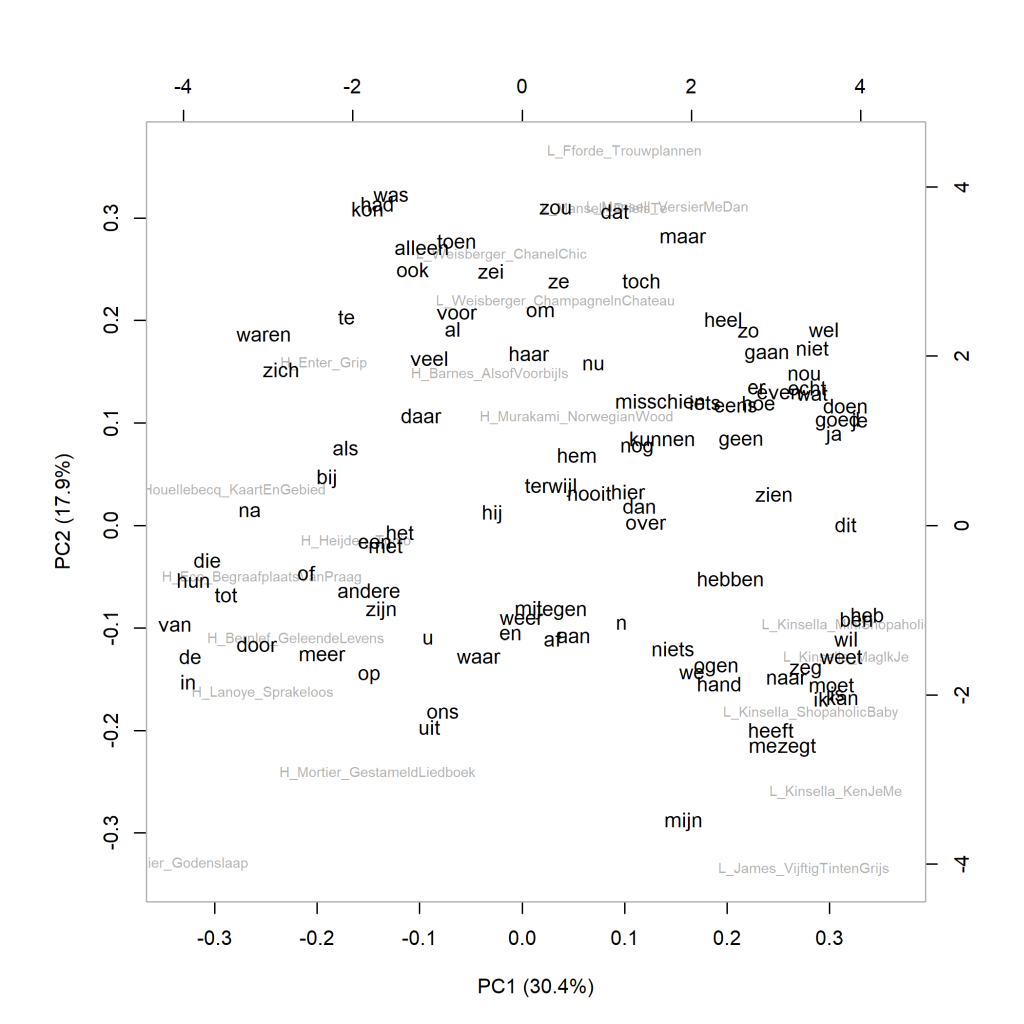
More about this measure: This principal components analysis calculates correlations in the frequencies of words used in the selected novels. Based on those correlations, how the book compares to the other novels in the selection is calculated for each novel. The first component reflects the cluster of correlated variables that together explain most of the variation in the data. The second principal component reflects the largest amount of correlating variables from the remaining variables (i.e. those that do not correlate with the first component). In the visualisation of a principal components analysis, we can see how the texts relate to each other on the first (pictured horizontally) and second (pictured vertically) components. The closer books are to each other, the more similar they are in the frequency pattern of the chosen number of most frequent words. References to more information about PCA can be found on pp. 69-70 of The Riddle of Literary Quality.
Figure 3.1.2: Top 10 most literary and least literary
Cluster analysis (130 most frequent words). Measure: Classic Delta.
Measuring the 130 most frequent words (MFW) and higher, the 10 novels rated most literary are always found together in the same cluster. The novels rated with low scores for literary quality by Weisberger, Fforde and Mansell, are just slightly more similar to the 10 most literary novels than to the other 5 novels, by Kinsella and James. At 110 and 120 MFW, we see the same picture as in Figure 3.1.2.
More on cluster analysis: In a cluster analysis, based on statistical grounds, the most similar texts based on words and word frequencies are always linked two by two, then the clusters that are most similar are also linked two by two, and so on. The visualisation of the measurement shows this as follows: The further to the right in the graph two books or clusters of books are connected by a vertical line, the more similar they are in the frequency of words analyzed. See The Riddle of Literary Quality p. 114 for more information.
More on Classic Delta: The ‘Delta’ is a number that indicates the degree of difference in word usage and word frequencies between texts that are part of a large corpus of texts. For each text in that corpus, the different words in it and how often each word occurs are identified. It then looks at how the use of each word in that text compares with the average use of that word in the whole corpus. For all selected words (e.g. the 100 most frequent or the 1000 most freuent words), the deviations of usage from the mean are added up: the ‘Delta’ score. See The Riddle of Literary Quality p. 19-21 for more information about the Delta score.
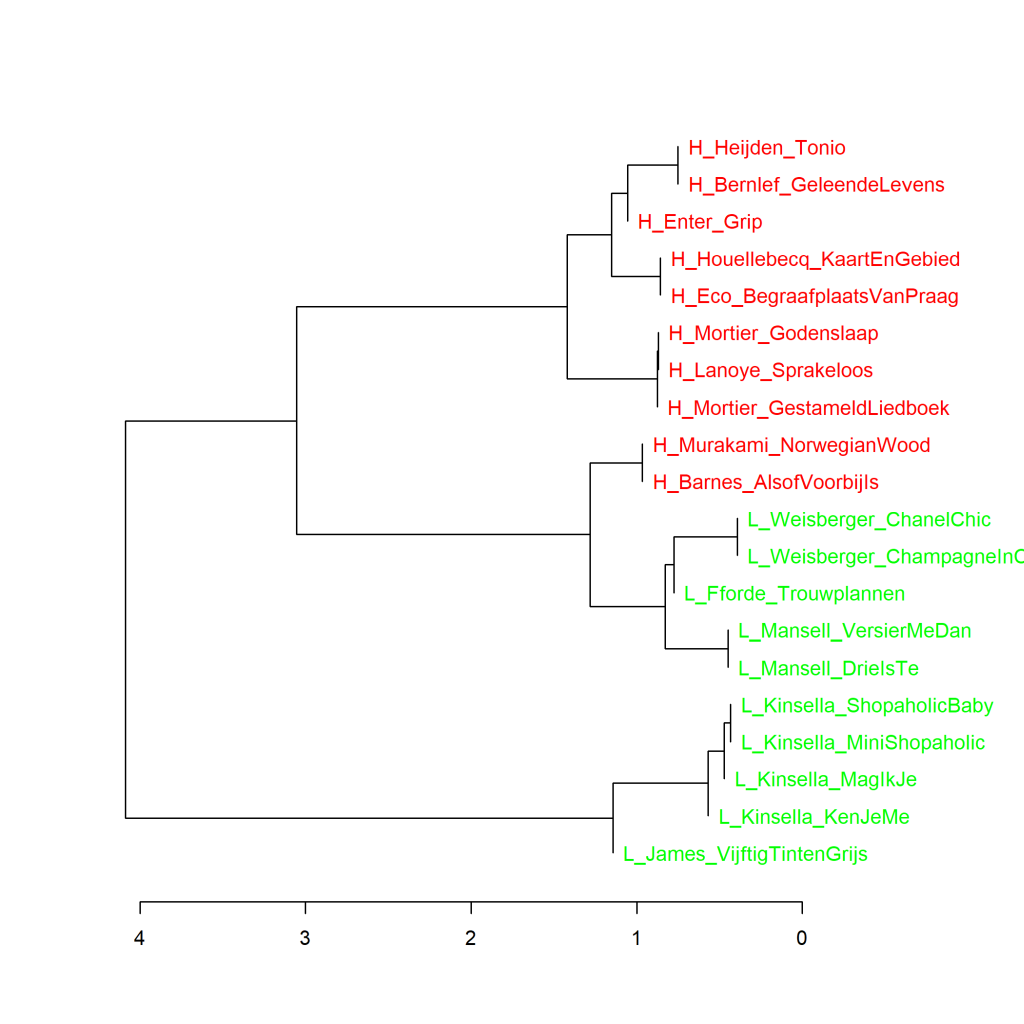
Figure 3.1.3: Top 10 most literary and least literary
Bootstrap consensus tree (100 - 1000 most frequent words, increment van 100, consensus strength 0.5). Measure: Classic Delta.
 As shown above, the outcome of cluster analyses based on different numbers of most frequent words (MFW) is not always the same. It is useful to do a whole range of different cluster analyses and then calculate some kind of average from them. This can be done by choosing a bootstrap consensus tree in Stylo. The graph below visualises the result of averaging cluster analyses made from the 100 MFW to the 1000 MFW with an increment of 100; that means a total of ten cluster analyses (100, 200, 300, …., 900 and 1000 MFW). The chosen consensus strength is 0.5, meaning that two novels or clusters are clustered together if they are most similar in at least half of the measurements. Figure 3.1.3 shows that the bootstrap consensus analysis in this case clusters all the most literary books found together against all novels that were considered least literary.
Figure 3.1.4: Top 10 most literary and least literary
Principal components analysis (1000 most frequent words). Measure: PCA, correlation version.
 In the visualisation of this measurement, we see that the 10 most literary books (H, in red) congregate on the left-hand side of the graph, that they differ most from the least literary books by James and Kinsella (L, in green), which appear on the right-hand side of the graph, and that the also least literary novels by Fforde, Mansell and Weisberger are closer to the most literary novels. The same picture can be found in graph 3.1.1, but the distances have widened now that we have looked at the 1000 rather than the 100 most frequent words.
Conclusion
The conclusion to be drawn from all these measurements (more on this in The Riddle of Literary Quality on p. 65-66) is that the most literary novels have a different word frequency pattern than the least literary books. In all likelihood, however, this has more to do with a genre difference and genre conventions at the level of word frequency than with a difference in assigned literary quality.